portal* - analytics
![]() Updated
by terrible*
Updated
by terrible*
A guide to portal* analytics
portal* helps artists and their teams manage their merchandise businesses in real time. It provides access to global inventory, sales reports for both online and at-show sales channels, exportable statements, invoicing, logistics tracking, concession or 'venue sell' reports, as well as analytics to measure and monitor merchandise businesses
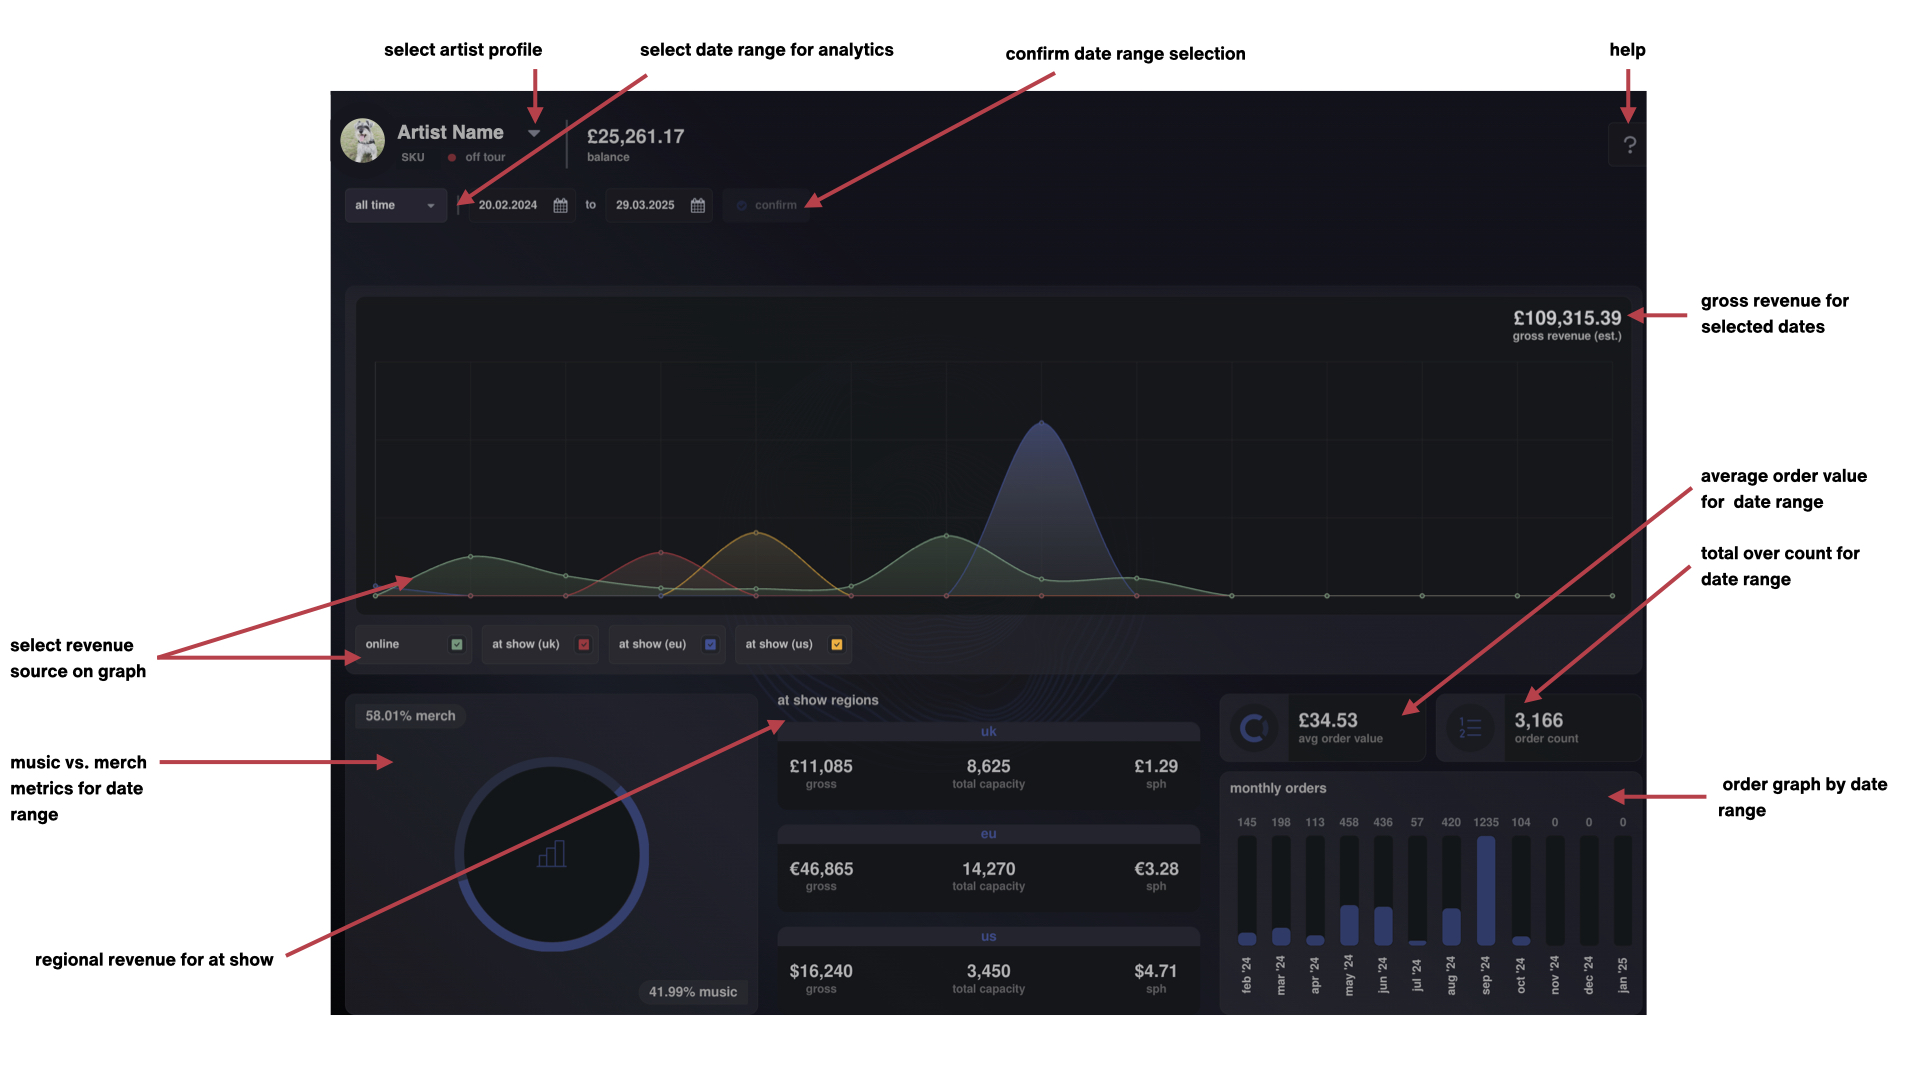
- After logging in, your default page will be your artist analytics page. Select the dates you wish to view analytics of under the artist name and logo
- If you have access to more than one artists' portal* dashboards, on the top left hand side of the screen, next to the portal* logo you can select artist. To switch artist profiles, click the artist logo and select the artist profile you wish to view
- Select the dates you wish to view analytics of under the artist name and logo
- Alternatively, you can use our most common presets below the artist name
- The graph will update
- Below the graph, you can find a key to each metric shown. You can select and deselect each to change the view
- Gross revenue for the dates selected is shown on the right-hand-side of the graph
- Below the graph you can view the following analytics:
- Music vs. merch percentages for date range
- At show revenue by region for the date range
- Overall average order value for date range
- Total order count for date range
- Order volume graph for date range